Bringing GenAI To Financial Planning Workflows
Incorporated Gen AI into the workflow of a financial planner in Oracle’s Enterprise Performance Management (EPM) platform
Tools Used: Figma, Confluence, Jira
Interaction Design, Financial Planning, Prototyping, Design Systems

About the project
Financial planners ensure organizations stay on track with their financial plans by analyzing performance, identifying deviations, and running what-if scenarios. With Generative AI, they can accelerate analysis, uncover drivers of discrepancies, and make better-informed decisions.
Problem Statement
Financial planners often need to identify why actual performance differs from planned projections, but this requires manually gathering and combining data from multiple systems like Oracle EPM Cloud, ERP data, and analytics dashboards. This process is time-consuming and forces users to spend more time collecting and organizing data rather than analyzing it.
Challenge
The challenge was to integrate Gen AI into the financial planning workflow in a way that simplifies complex analysis and reduces manual effort, while ensuring the solution remains contextual, trustworthy, and useful for expert users.
My Role & Team
Role: UX & Visual Designer
Team: 5 (1 Product Manager, 2 UX Designers,
2 Product Developers)
Duration: June 2024 - Sept 2024
Business Goal
Enable financial planners to leverage Generative AI to:
-
Quickly identify root causes of plan vs. prediction gaps.
-
Simulate scenarios to assess risks and outcomes.
-
Recommend the best course of action to improve performance.
Outcome
-
60–80% reduction in manual analysis effort through automation of key tasks
-
70–90% faster insights, reducing analysis time to under 5–10 minutes
-
50–70% fewer user interactions, simplifying workflows into 1–2 AI queries
-
~30–40% improvement in task completion for key analysis tasks
-
Higher user confidence, enabling independent decision-making without expert support
We followed an Agile way of working, where the product development was divided into multiple sprints. To make sure design stayed aligned with development, designers usually worked one sprint ahead, so we had enough time to explore ideas, validate concepts, and iterate before development started.
This project involved close collaboration with cross-functional teams including product managers, developers, and other designers. We regularly discussed product goals, technical feasibility, and development constraints to make sure the solutions we designed were practical to implement. Developers were involved throughout the process, which helped us quickly understand limitations and adjust designs early instead of discovering issues later. As a team, we made sure to discuss and align on ideas before implementation, which helped keep the workflow smooth.
We also followed daily stand-ups, where the team shared updates, discussed blockers, and planned the next steps. Throughout the project, I used methods like user research, journey mapping, competitive analysis, ideation, wireframing, and usability testing to explore solutions and refine the AI-assisted experience.
Project Kick-off
Clarity of Purpose
Before starting the project, I wanted to clearly understand the problem space and align with the team on the project goals. My focus at this stage was to gather the right context before moving into the design process. I aimed to understand key aspects such as:
1) The stakeholders’ expectations from integrating Gen AI into the product
2) The reason behind introducing this feature
3) The core problem we were trying to solve for financial planners
4) why users would actually find this capability valuable
I also wanted to understand the challenges existing users were facing while analyzing support tickets, the project timeline and constraints, and how success would ultimately be measured.
To answer these questions,I had a discussion with product manager and these conversations helped me understand the current workflows, existing user pain points, and the vision for AI within the product.

1. Empathising with the users
Qualitative Research
Design Process
I followed a structured design process: starting with empathizing and conducting affinity mapping, then defining user personas, moving into ideation with card sorting, creating user flows and prototypes, and finally testing to validate the experience.
To design a Generative AI solution that financial planners would actually trust and use, we first conducted user research to understand how they work and what challenges they face in their daily workflow.
-
Method: We mainly used interviews and contextual inquiry sessions, where we observed planners while they were working with financial dashboards and data. The goal was to understand their pain points, how they currently analyze data, and what would make them feel comfortable using AI in their decision-making process. I also wanted to understand the existing workflow, project timelines, constraints, and how the success of the solution would be measured.
-
Audience: For this research, we spoke with experienced financial planners who regularly work with complex financial data and are responsible for making important financial decisions.

Questions Asked
-
Which tasks in your workflow are repetitive or time-consuming?
-
How comfortable are you with AI suggesting insights or automating calculations?
-
What makes you trust or distrust an AI-generated recommendation?
-
How should AI present insights without overwhelming you or breaking your workflow?
Outcomes:
-
Users preferred user-initiated AI to maintain control.
-
Insights must be contextual and connected to the dashboard to be actionable.
-
Transparency and explainability were critical for trust.
-
Simplified, plain-language summaries and key drivers improved usability.
These insights directly shaped the AI panels, interaction design, and output presentation, balancing automation with user control and trust.
Competitive Analysis
I looked into over 15 products and their AI Assistants. I then summarized each AI experience and categorized them in order to be able to properly compare them to our use case and to each other.
Omnipresent: the product’s AI assistant is meant to be used throughout the application.
Contextual: the AI is only is revealed within a particular context of the application.
General audience: all users of the application would benefit from the AI assistant
Specific audience: the AI is directed towards a subset of users.
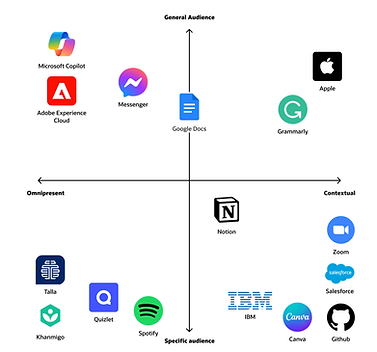
Insights
Insights #1

Omnipresent AI assistants are generally in the form of chat bots because its uses are more general.
Insights #2
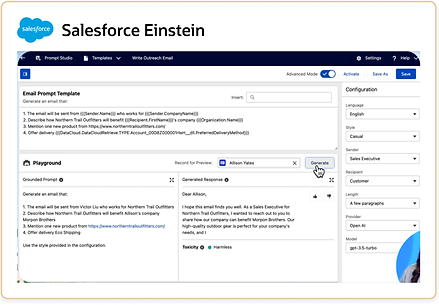
AI assistants with specific use cases and specific audiences are in the form of input/output boxes.
Insights #3

Prompt suggestions are displayed to help the user understand how the AI assistant is intended to be used.
Insights #4

AI editing tools can directly insert generated content whereas more general AI tools cannot.
2. Defining The Goals
Problem Statement
When financial planners notice a gap between planned and actual performance, the next step is figuring out why it happened. However, this is rarely straightforward. To understand the root cause of a discrepancy, planners often need to manually collect data from multiple systems such as Oracle EPM Cloud, ERP transactional data, analytics dashboards, and reporting tools.
In most cases, this data then has to be exported and stitched together in spreadsheets to identify the key drivers behind the issue. This process can involve switching between several tools, applying filters, and running multiple calculations — turning what should be a quick investigation into a time-consuming and tedious task. As a result, planners spend more time hunting for insights rather than actually making decisions based on them.
As a financial planner, I need to leverage Gen AI to quickly analyze data and understand the causes driving a discrepancy between a plan and a prediction so that I know what I need to explore in order to mitigate the discrepancy.
As a financial planner, I need to leverage Gen AI to create different scenarios and understand their impact so that I can recommend the best course of action to address a discrepancy to a plan.
User Persona
With the data collected from the interviews and contextual inquiries, I created a persona representing a user I am designing for, This user is a financial analyst, specifically at an automobile manufacturing corporation. It is important to note that she is an expert user, which means that she knows how to pull information from a page and requires less overall guidance.

I was able to break down the steps a financial planner takes into key stages:
-
Discover — The user becomes aware of discrepancies.
-
Learn — The user understands causation behind a discrepancy.
-
Explore — The user works with data to determine potential solutions.
-
Take action & Monitor — The user works with stakeholders to act according to an insight.
From here, I mapped out the decision tree of a financial analyst to understand the key action points. This allowed me to simplify the user's interactions so I could create the optimal model for a financial analyst to learn and explore data.

3. Ideating Ideas
How Might We?
After defining the problem statement, we ran a “How Might We” brainstorming session with the product manager and tech team to generate multiple solution ideas, focusing on quantity while ensuring feasibility within the timeline and technical constraints.
How Might We Formula


User Flow
After we picked the most promising ideas, I mapped out how users would move through the system to complete their tasks. I created a user flow to show step by step how a financial planner would interact with the system.

Leveraging Gen AI to…
Learn — help users quickly analyze data and understand the causes driving a discrepancy between a financial plan and predicted actual.
Explore — rapidly create different scenarios and understand their impact.
4. Design Exploration
Design Exploration 1: Chat Bot VS. Input/Output Box
My first design exploration integrated a chat bot into the user flow because this was an extremely relevant pattern in my research.
In this exploration, the user wants to understand why the variance is high in this chart, so she asks the AI assistant which can be accessed globally. This opens a chat panel where the user can ask about the data on the page.
This concept was quickly discarded for a few reasons. The first is that according to my research, chat bots are most useful when their use cases are more general. However, my research suggested that for specific use cases, such as financial planning, input/output boxes are much more successful patterns. Another takeaway is that this chat bot doesn’t really feel connected to the page, which is a huge drawback for our use case where the user is constantly asking questions about the information on the page.

Design Exploration 2: Ready Only Pages
A question I had while designing was how to handle read-only pages versus pages we were modifying. The dashboard page is intended to be read-only, so I explored this option of asking questions about the content on the page in a page-level magic box, which then opened an insight panel for the AI generated response. From here, the user could expand the data in a dynamic tab and ask further questions.
The idea here was that the user would be able to see the full page on the left while interacting with the response in the right panel. However, we ultimately felt that this interaction didn't fully justify the space the panel took.

Design Exploration 3: Object-level magic boxes
Within our explorations of read-only pages versus pages intended to be modified, a key distinction I explored was page level magic boxes versus object level magic boxes.
Here, the idea was that the user wanted to run a what if analysis on this data set, which is an action that modifies the page, so they would be able to click into the data visualization and add scenarios right there in situ.
However, we realized that specifically for pages dedicated to running what-if predictions, the visualizations on the page would all be related to the same data. This made it counterintuitive for the user to click into specific data sets and ask object-level questions since the questions inherently were about all the data on the page.

Design Exploration 4: Page-level magic boxes
This differs from a page-level magic box, which is demonstrated in this exploration.
Here, the user would interact with the data by dragging an empty canvas into the page, prompting the search box at the top of the page, which would then fill the empty canvas in response.
As I continued exploring the best patterns, I realized that specifically for pages dedicated to running what-if predictions, the visualizations on the page would all be related to the same data. This made it counterintuitive for the user to click into specific data sets and ask object-level questions since the questions inherently were about all the data on the page. From these explorations, we were able to narrow that pages dedicated to expanding 1 data set would benefit more from page-level magic boxes.

5. Final Designs
User Journey: Learn
In this flow, Simone, a financial analyst, returns from vacation and opens the daily flash forecast to find Q3 profit falling short of plan due to a revenue gap. Using the embedded Ask Oracle component directly within the data visualization, she asks clarifying questions about the shortfall and receives AI-generated insights with transparent data sources. As she drills down into the contributing factors, Commercial Vehicles in this case, the AI dynamically expands the analysis, helping her uncover that an over-forecasting bias caused the variance and enabling her to act on the findings within minutes instead of days.

User Journey: Explore
In this stage, Simone moves from understanding why the gap exists to exploring how to close it. She asks the AI for recommendations to meet her revenue target, fully guiding the interaction herself. The AI responds with potential strategies and opens a dynamic tab where she can test what-if scenarios directly in the interface.
Since she's adjusting a single data source, this uses a page-level magic box that lets her add or edit scenarios inline without breaking focus. Curious about marketing's impact, Simone runs a goal-seeking analysis to see how much additional ad spend it would take to reach plan. The AI calculates roughly $350M, which she saves and shares with her team to discuss next steps.

Full Walkthrough
Challenges Faced
-
One of the main challenges in this project was balancing automation with user control. Financial planners are experienced, so if AI takes too much control, they lose trust. But if it does too little, it doesn’t save any time. We solved this by making the AI user-initiated planners ask questions when they need insights, and the AI responds without interrupting the workflow.
-
Another challenge was avoiding the generic chatbot problem. A simple chatbot would give answers disconnected from the actual dashboards, which isn’t helpful. So we designed contextual AI panels embedded directly in the workflow, making sure insights are always relevant to the data the user is viewing.
-
Building trust in AI outputs was also critical, because financial decisions are high-stakes. We addressed this by showing the source data behind every insight, allowing users to verify the AI’s reasoning.
-
Finally, we had to handle complex financial data without overwhelming users. Dashboards are dense, and it’s easy to get lost. We simplified AI outputs into key drivers, plain-language summaries, and actionable insights, so users could quickly understand the data and make decisions efficiently.”
KPIs Used to Measure Success
1. Time to Insight
This measured how long it takes a user to identify the root cause of a discrepancy.
-
Before the solution: Users often spent hours or even days gathering data and analyzing it.
-
After introducing AI: The goal was to reduce analysis time to a few minutes.
2. Reduction in Manual Effort
This measured how many manual steps were eliminated.
-
Before the solution: Users switched between multiple tools, Exported data, Joined data in spreadsheets
-
After introducing AI: AI could summarize drivers directly from the data.
Success was measured by a 60–80% reduction in manual analysis steps.
3. Workflow Efficiency
We measured how many clicks, filters, and dashboard navigations were required to get an answer.
Success meant reducing the process from 10–15 steps to 1–2 AI queries.
4. Task Completion Rate
We evaluated whether users could successfully:
-
Identify variance drivers
-
Understand key insights
-
Run scenario analyses
An improvement in task completion rate indicated the system was easier to use.
How Success Was Measured
Success was measured through:
1. Usability Testing
Users were given tasks such as: “Find the reason behind a revenue drop.”
We measured:
-
Time taken
-
Steps performed
-
Whether they reached the correct insight
2. User Feedback
We also gathered feedback from users to understand:
-
Whether the AI insights were helpful
-
Whether they trusted the outputs
-
Whether the feature saved them time
Key Takeaways
One of the biggest takeaways from this project was understanding that AI is most valuable when it assists users rather than replacing them. Financial planners are experts in their domain, so the goal was not to automate their decision-making but to help them reach insights faster. Designing the AI as a supportive assistant that users can interact with when needed proved to be more effective than creating a fully automated system.
Another important learning was the significance of context in enterprise AI products. Generic AI responses are not very useful in complex tools. The insights become meaningful only when the AI understands the specific data and context the user is working with. Embedding AI directly within the workflow made the experience far more useful and relevant.
This project also highlighted the importance of building trust in AI-driven systems. Since financial decisions involve high stakes, users need transparency in how insights are generated. Providing clear explanations and showing the source data helped improve confidence in the system.
Finally, I learned that good UX design plays a critical role in making advanced technology usable. Even the most powerful AI capability can fail if it is not integrated thoughtfully into the user’s workflow. Keeping the interaction simple, contextual, and non-intrusive ensured that the feature added real value to the users’ daily work.